Data-driven HR
Struggling to turn HR data into stories that impress leadership? Our content hub has the answers. 📈
Explore our content hubHR Metrics That Teams Need to Know

Which HR metrics are most likely to move the needle for your organisation? In this article, we’ve compiled the top metrics that forward-thinking organisations are using to make more data-driven decisions.
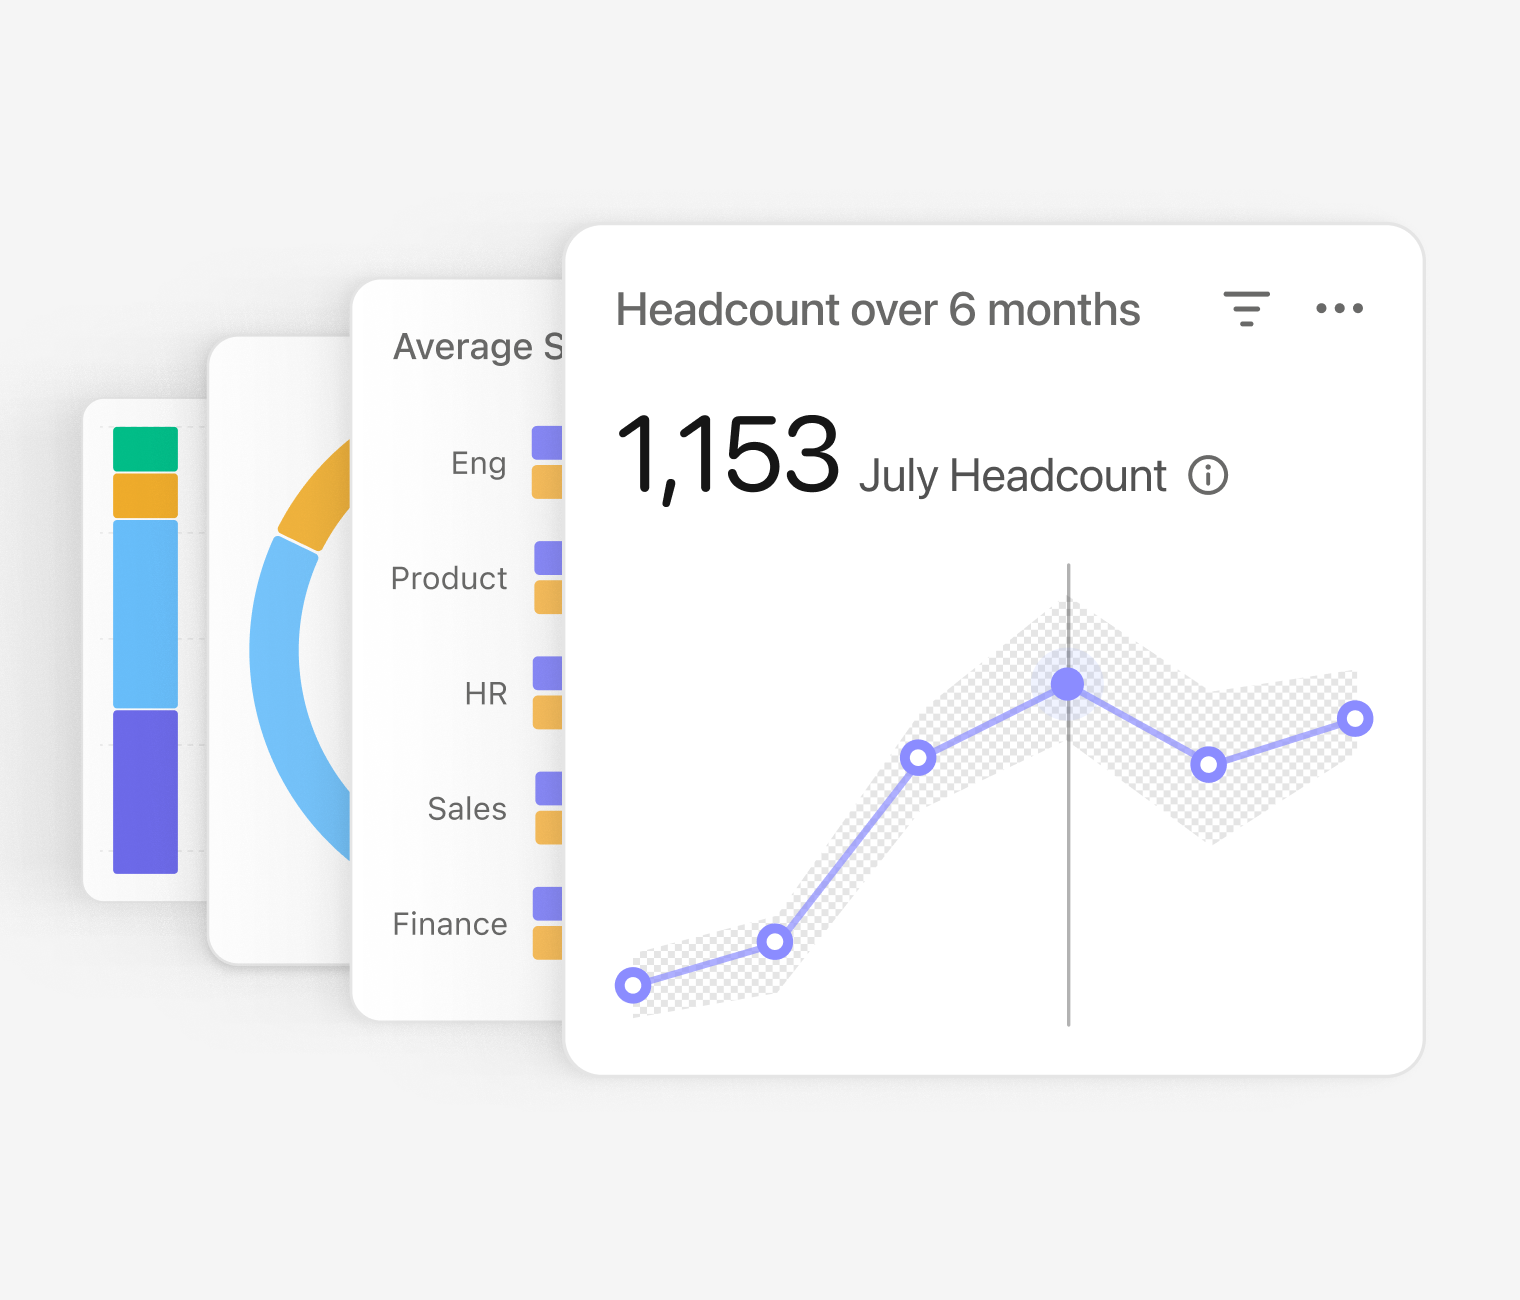
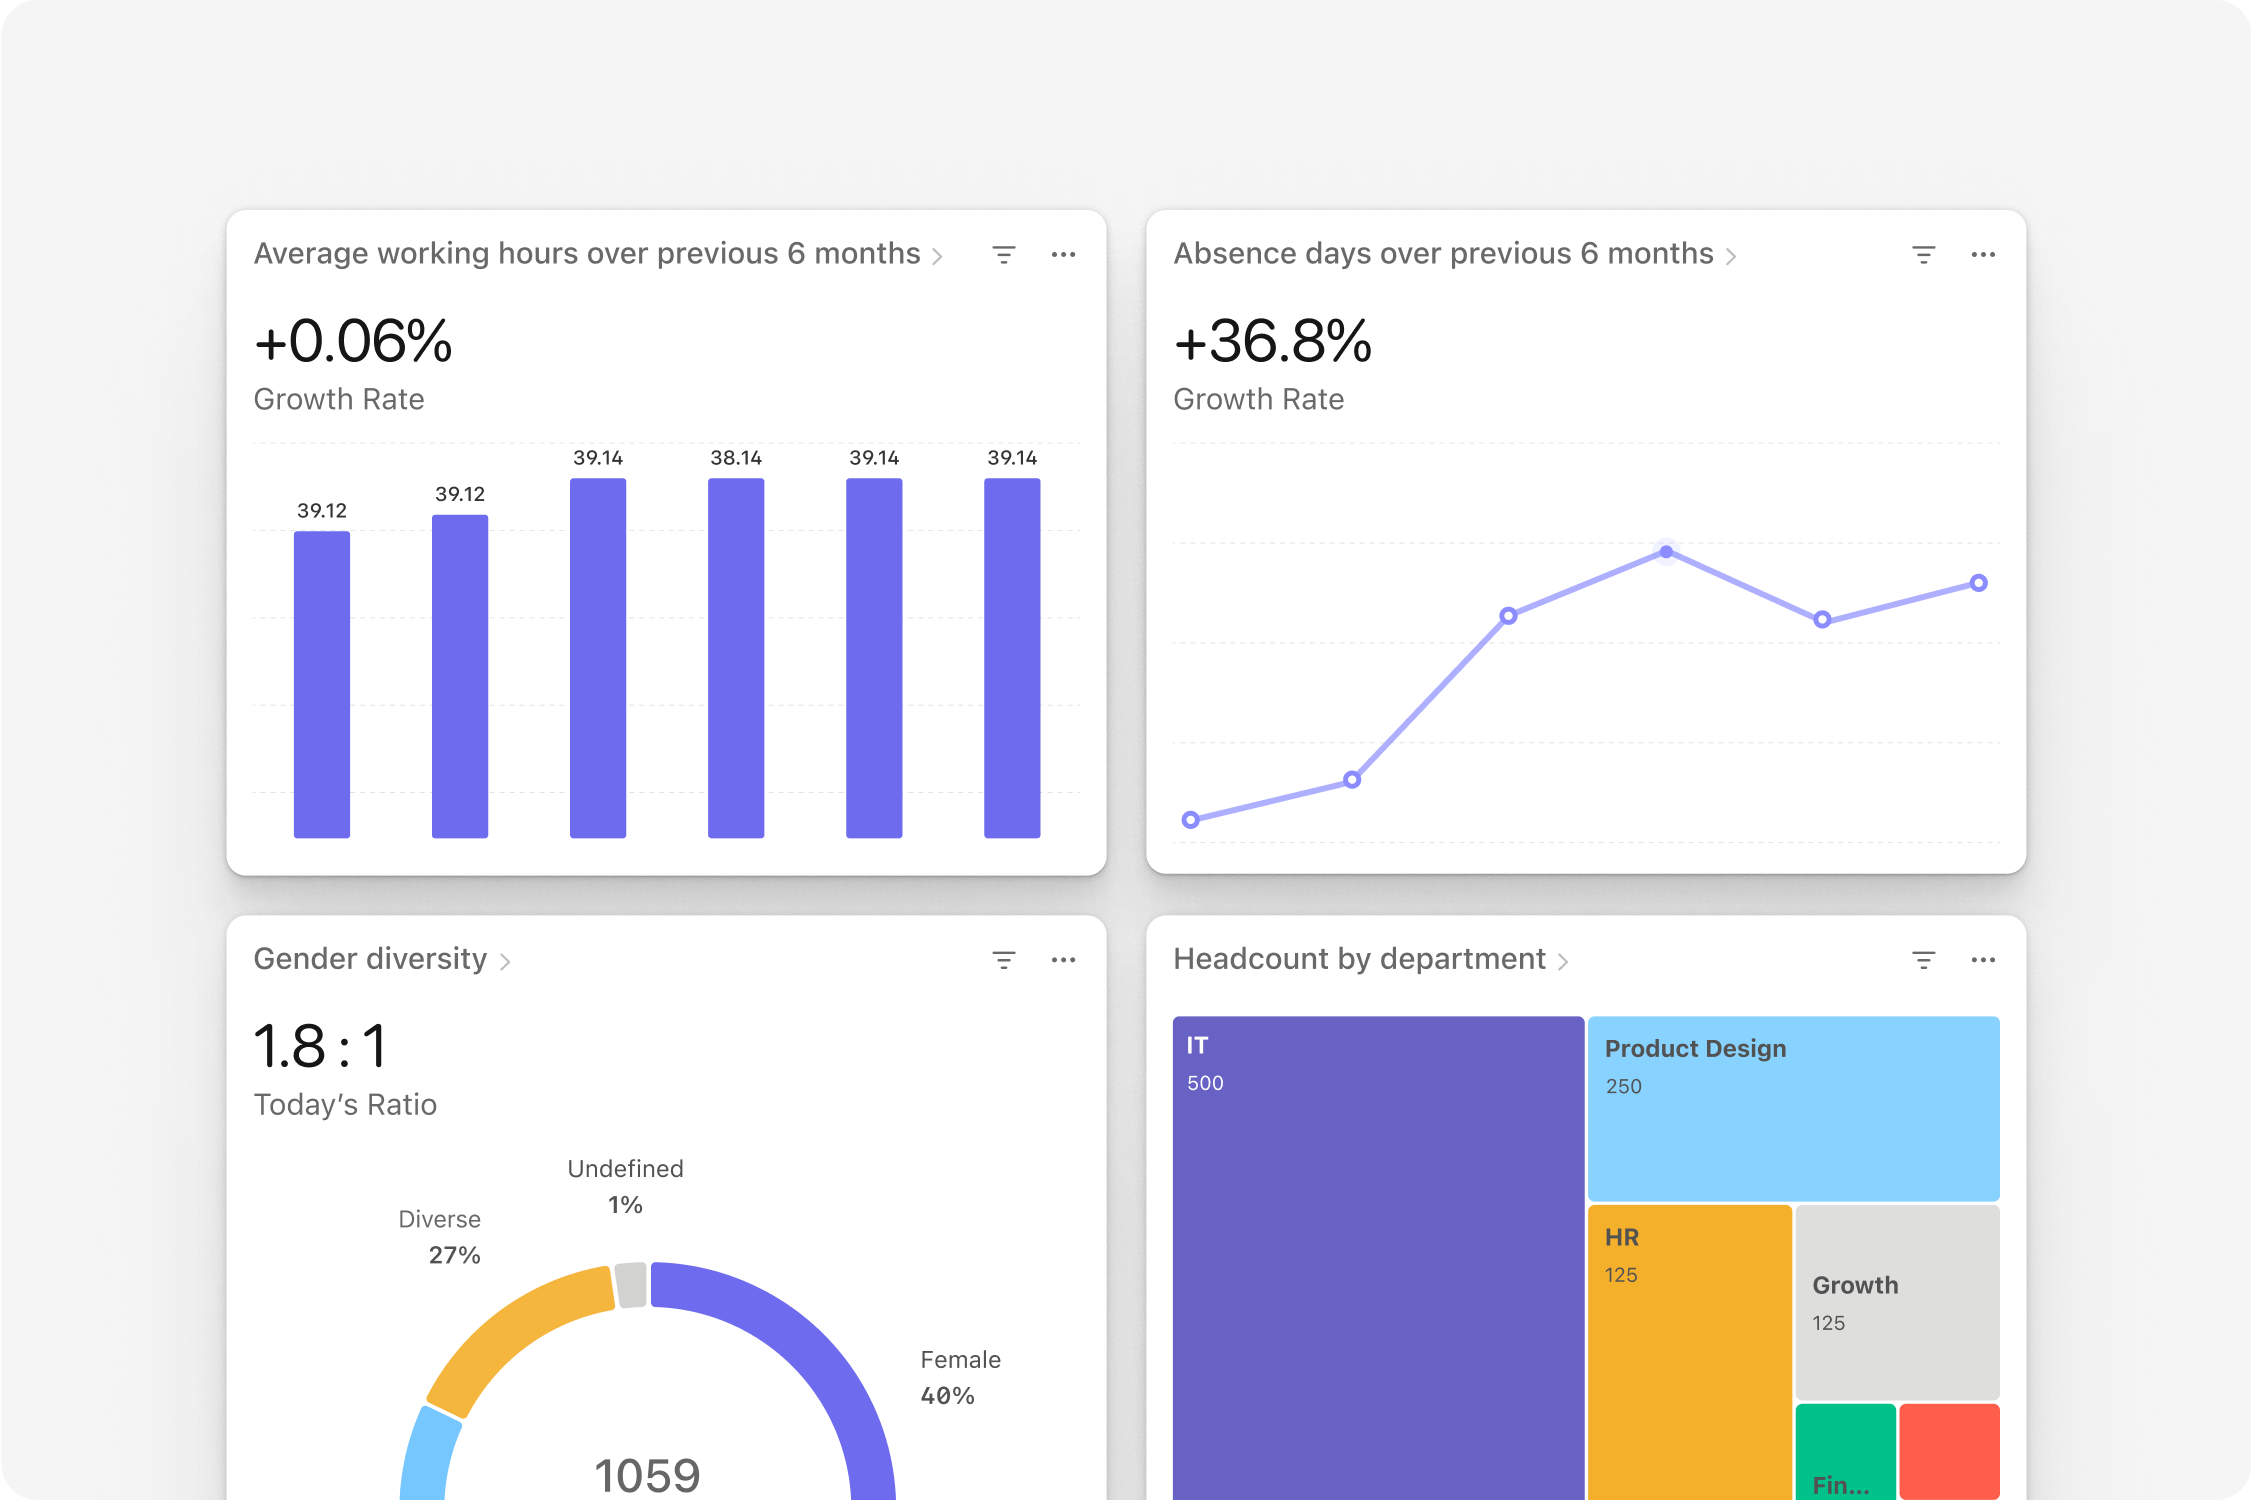
Personio offers an intuitive and reliable reporting and analytics dashboard. Take a look.Contents
- 1What are HR metrics?
- 2The top 10 HR metrics for 2025 and beyond
- 3Diversity, equity and inclusion (DE&I) metrics
- 4Employee net promoter scores (eNPS)
- 5Skills gap metrics
- 6Learning and development (L&D) metrics
- 7Remote work effectiveness metrics
- 8Cost-per-hire metrics
- 9Time-to-hire metrics
- 10Employee wellness indicators
- 11Retention rates
- 12People analytics maturity metrics
- 13Gain access to critical HR metrics
What are HR metrics?

HR metrics are quantifiable measures that offer valuable insights into various aspects of the workforce, such as recruitment, employee engagement and performance.
By tracking and analysing these metrics, HR professionals can:
Gain a deeper understanding of their workforce: HR metrics provide a clear picture of employee demographics, skills and satisfaction levels, enabling HR to tailor initiatives to specific needs and challenges.
Identify areas for improvement: Metrics can identify inefficiencies in processes, talent gaps and areas where employee wellbeing needs attention. This allows HR to focus their efforts on areas with the highest impact.
Measure the effectiveness of HR initiatives: Given the right data, HR professionals can assess the success of their strategies, such as training programmes, engagement campaigns and retention efforts.
Make data-driven decisions: HR professionals can move beyond intuition and make informed decisions based on data. This strengthens their credibility and fosters a culture of data-driven decision-making within the organisation.
The top 10 HR metrics for 2025 and beyond
1. Diversity, equity and inclusion (DE&I) metrics
While the concept of DE&I is broad, the metrics used to measure progress can be quite specific. These can include:
Representation ratios: | The percentage of employees from various demographics (e.g., gender, race, ethnicity, LGBTQ+) in different levels of the organisation compared to the overall population or industry average. |
Pay equity analysis: | Analysing salary data to identify and address any gender or race-based pay gaps. |
Employee sentiment surveys: | Conducting regular surveys to gauge employee perceptions of fairness and inclusion within the workplace. |
Most important, what you’ll find in this group are metrics that are reactive (identifying existing pay gaps, for instance) and those that are more proactive (like gauging sentiment to roll out new initiatives). Striking this balance is critical.
2. Employee net promoter scores (eNPS)
Your eNPS remains a valuable metric, as it can help you gauge employee sentiment, potential turnover and retention overall. The first thing to know is that you should track it, but that you can also augment it.
Consider supplementing your eNPS with more specific metrics, including:
Employee participation rate in voluntary activities: | This could include participation in company events, employee resource groups or internal surveys. |
Company review participation rates: | Track both the qualitative and quantitative rates of employees reviewing your company on platforms like Glassdoor. |
The trickiest part of thinking through your eNPS is keeping in mind that it is only one metric and it often lacks real, qualitative insights. To assist with that, consider the above to build out the “universe” of your eNPS.
3. Skills gap metrics
Many organisations implement skills gap analyses to get a read on the skills their organisations are missing. That said, for this metric to be effective it also needs to be a bit reflexible. Instead of focusing solely on gaps, consider:
Number of employees who have completed training programmes: | Track completion rates for critical skills development programs and identify areas where additional training is needed. |
Time to proficiency for new hires: | Measure the average time it takes for new hires to reach full proficiency in their roles, which can help identify areas for improvement in onboarding and training processes. |
How do you go about measuring proficiency? For roles that aren’t as quantifiable, this often results in rating employees in coordination with line managers. While this is a subjective measure, it can definitely paint a clearer picture.
The People Manual: HR Analytics & KPIs

Over half a decade of collected insights on everything related to the KPIs that drive success in HR. Grab your free copy right now.
Download your copy today4. Learning and development (L&D) metrics
L&D programmes are often the subject of increased scrutiny when it comes to return on investment (ROI). The truth is that the impact of L&D is incredibly tangible, but your teams need to focus on how you tell that story through data.
To communicate the efficacy of your programmes, keep these metrics in mind:
Increased productivity post-training: | Track key performance indicators (KPIs) relevant to specific roles to measure the impact of training on individual and team performance. |
Employee promotion rates: | Analyse whether employees who participate in training programs are more likely to receive promotions compared to those who don't. |
eNPS: | Turning back to our conversation on promoter scores, your team may also be able to observe a before-and-after effect on eNPS scores, employee engagement and the trickle down impact of reduced churn in the business. |
5. Remote work effectiveness metrics
The trickiest part of remote work is ensuring that you don’t engender a culture of presenteeism or employee monitoring. Neither of these are going to truly rate or improve your remote work effectiveness.
Instead of generic productivity measures, keep these in mind:
Number of completed tasks per week/month: | This provides a more concrete measure of individual and team output in a remote setting. |
Internal collaboration tool usage data: | Analyse data on internal communication and collaboration tools to assess the effectiveness of remote teamwork and identify potential areas for improvement. |
6. Cost-per-hire metrics
Your cost per hire includes the entire amount it takes to bring someone into your organisation. This includes things like salary, benefits, time invested, hiring infrastructure, software costs, relocation fees and more.
The problem here is that cost per hire can quickly become a monolithic metric, meaning that it’s virtually impossible to decipher and figure out where you could make improvements. Here are some ways to help add focus:
Cost per hire by sourcing channel: | Track the cost associated with acquiring talent through different channels (e.g., job boards, employee referrals, recruiting agencies) to identify the most cost-effective sources. |
Time to fill open positions by department: | Analyse variations in time to hire across different departments to identify bottlenecks and streamline recruitment processes. |
7. Time-to-hire metrics
Organisations are always looking for ways to hire faster. When it comes to time to hire, otherwise known as the average time taken to fill a role, consider the following:
Number of interview stages per role: | Analyse the number of interview stages required for different roles and assess if they're essential for effective candidate selection. Try and benchmark this for various levels of seniority (junior, associate, senior, etc.). |
Time between interview stages: | Track the time it takes to move candidates between different interview stages and identify areas for improvement in scheduling and communication. |
The fact of the matter is that it takes time to hire great talent, and sometimes you can’t really negotiate or change that. That said, an effective applicant tracking system (ATS), like the one Personio offers, can have an outsized impact.
It can streamline the stages of the interview, keep in touch with candidates via built-in automations and turn candidates into employees in only a few clicks. All of that, and so much more to help your teams do great HR and recruitment work.
8. Employee wellness indicators
Being able to track employee wellbeing has proven difficult for organisations. While you can track things like healthcare benefits usage, the trick of this metric is that you need qualitative data to understand the wellbeing of your workforce.
So, looking beyond just healthcare utilisation, we should keep in mind:
Employee absenteeism rates: | Track the percentage of employees who are absent from work due to illness or other reasons. High absenteeism rates can indicate potential issues with employee well-being or workplace conditions. |
Employee burnout surveys: | Conduct regular surveys to gauge employee stress levels, workload perceptions, and burnout risk. Early identification of these issues allows for proactive intervention and well-being initiatives. |
Effortlessly create and analyse surveys

Measure your employee engagement with a seamless survey process. Now you can design, send and analyse your next employee survey in one place.
See it in action9. Retention rates
Too often organisations treat retention as a singular metric. It’s either high or its low when, truth be told, not all retention is the same. While focusing on it is important as a “big rock,” organisations would be wise to build this metric out with:
Voluntary turnover rate by department or role: | Analyse which departments or roles experience higher turnover rates to identify areas where retention efforts might be most needed. |
Reasons for employee departure through exit interviews: | Conduct exit interviews to understand why employees are leaving the organisation and use these insights to address potential issues and improve retention strategies. |
Regretted versus expected churn: | Map the results and ratings of performance cycles to turnover in your organisation. You can simply define regretted churn as employees leaving who were last rated as performing on a high level. If that metric jumps, think about how you could address it or why it is happening. |
10. People analytics maturity metrics
The people analytics function of your organisation is only going to become more important. Now more than ever, HR professionals need to be equipped with the data that they need to make truly data-based decisions.
To assess the maturity of the data function within your HR team, consider:
Number of HR professionals trained in data analysis: | Invest in training and development opportunities to equip HR professionals with the skills needed to effectively analyse and utilise data for decision-making. |
Integration of HR data with other organisational data sources: | This allows for a more holistic view of the workforce and enables HR to analyse the impact of HR initiatives on broader organisational goals. |
Personio’s HR software takes the need for data incredibly seriously. We’ve built out an analytics and reporting feature that is second to none, and helps give your team access to the data they badly need – when and however they need it.
Enable Data-Led Decisions

Collect and organise important HR insights such as absences, attrition, and more. Generate detailed reports in seconds so you can strategise with confidence.
Unlock detailed HR analyticsGain access to critical HR metrics
By leveraging any of these tangible and actionable HR metrics, HR professionals can gain valuable insights into their workforce, identify areas for improvement and make data-driven decisions that contribute to unlocking the power of your people.
Learn more about data-based decision-making with Personio, or skip ahead and speak with one of our experts right now to bring more HR metrics to your organisation.
